Most AI waits for questions. Plixer AI does the work.
Plixer AI triages alarms, pulls the related flow data, and writes the first incident brief before the analyst opens the queue. The same flow data that traces a performance issue to a congested interface traces suspicious traffic to the host involved, the systems it communicated with, and a timeline of activity.


AI that works the queue, not just the chat
Plixer AI doesn’t wait for an analyst to ask the right question, open the right report, or pivot to the right host. For each scheduled run, it correlates flows on the highest priority alarms, ranks risk or impact, and writes the first incident brief. When an analyst opens an investigation, the AI keeps working: answering plain-English questions, running the right reports, and pulling supporting flow data on request.
Analysts don’t have to start in Scrutinizer to get there. Scrutinizer MCP connects the same flow data, alarms, and runbooks to whatever AI assistant your team already uses like Claude, enterprise ChatGPT, or an agentic SOC platform. Investigations run from the tool analysts already have open.
Connect your AI assistant to Scrutinizer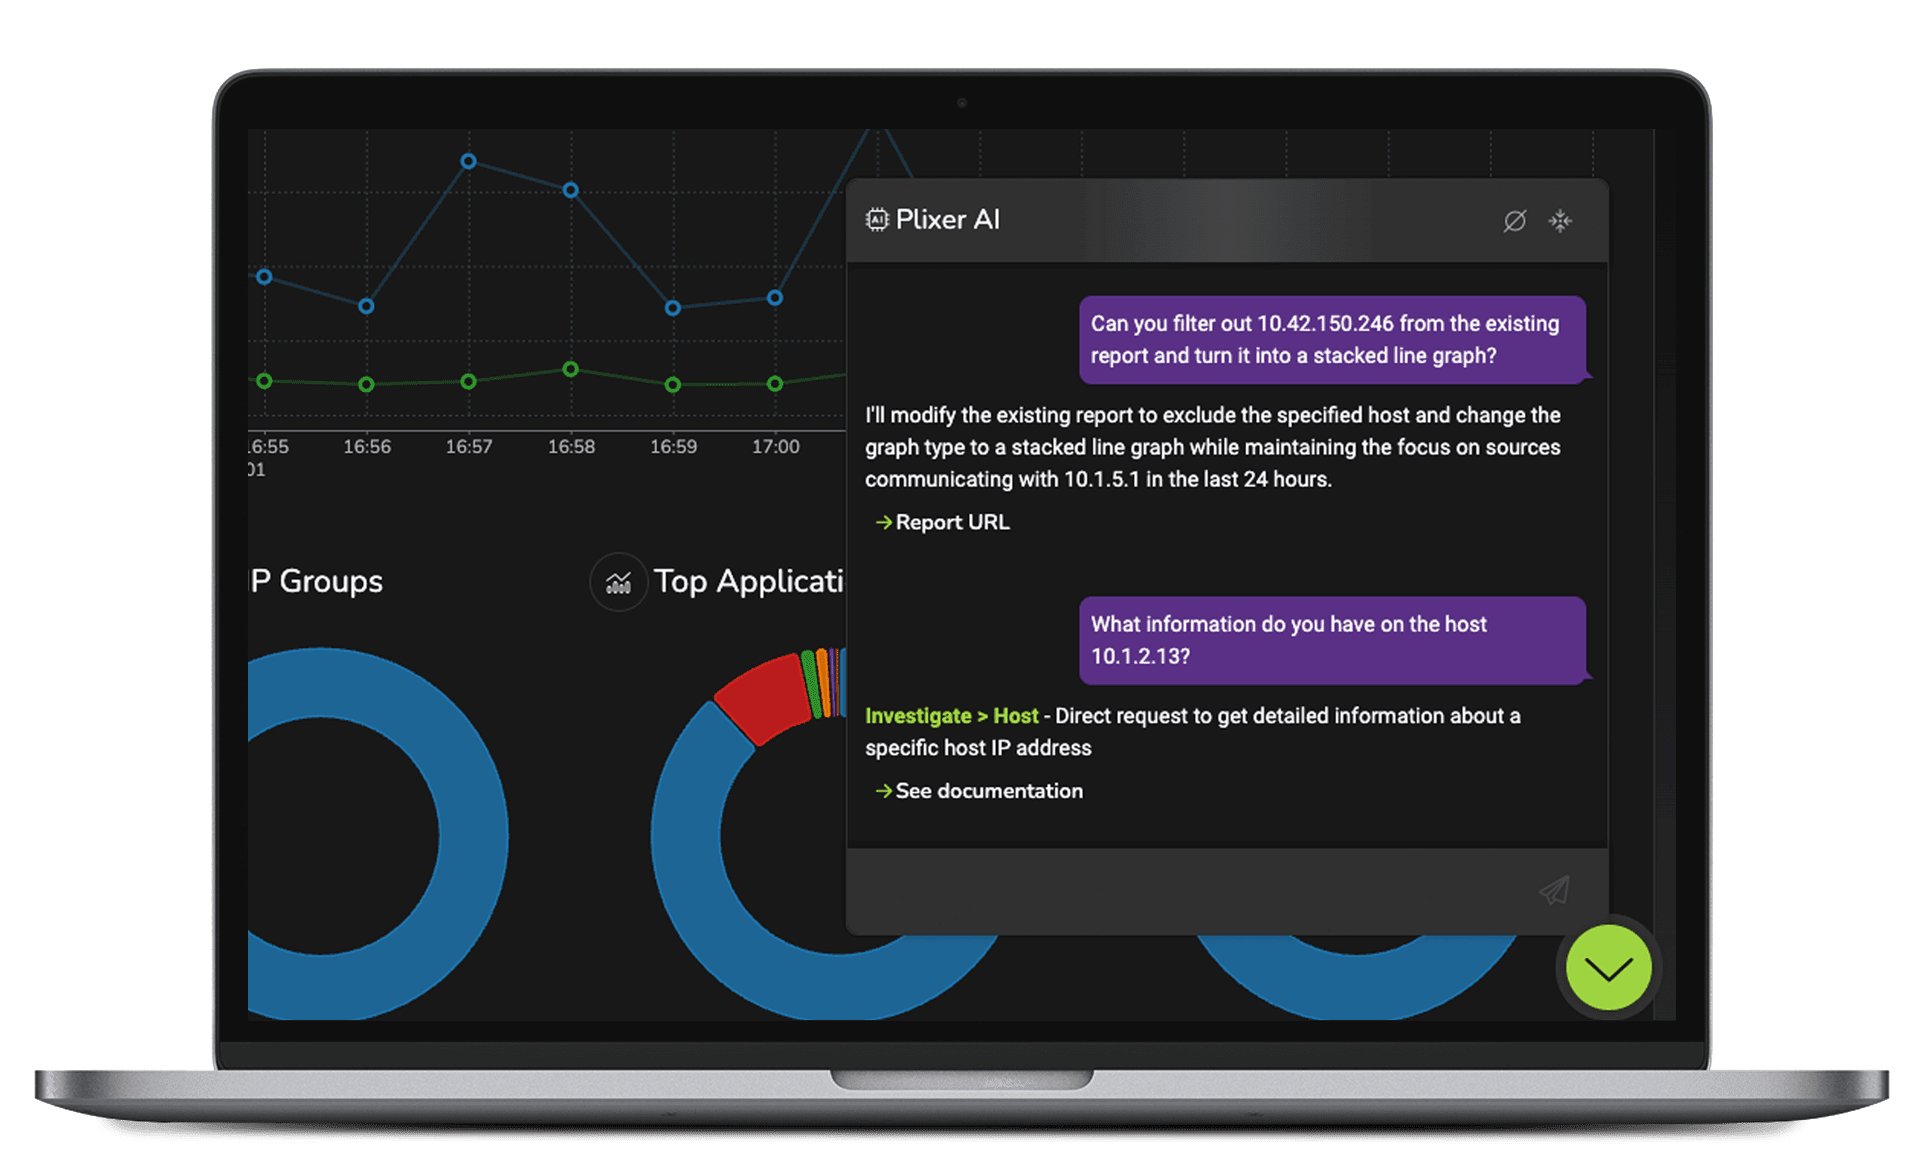
Your AI assistant can now ask what happened on the network
Most analysts don’t start every investigation in Scrutinizer. They start in whatever tool they already have open. Scrutinizer MCP closes the gap. Teams ask questions in Claude, enterprise ChatGPT, or an agentic SOC platform and get answers grounded in real Scrutinizer flow data, alarms, reports, detections, case records, and runbooks.
A tier-1 analyst stops writing filter expressions and stops opening a second tab to remember syntax. They describe what they need in plain English. The AI resolves the entities, runs the report, pivots to the relevant hosts, and drafts the summary. Every investigation can produce a structured case file with linked alarms, hosts, reports, notes, and timestamps answering the compliance question that kills most AI pilots: how do you prove what the AI did, and why?
MCP is the access layer. Scrutinizer’s flow data is the evidence.
Core Capabilities
Plixer AI works the alarm queue overnight. By the time analysts sit down, the top alarms have a triage summary, a risk or impact score, the correlated flows pulled, and a recommended next step from the customer’s own runbooks. The 8 a.m. queue review starts where it used to end.
Plixer AI connects each alarm to the related flow data, affected hosts, peers, interfaces, applications, and timelines. The investigation starts from evidence, not a guess.
Plixer AI produces a clear summary with likely cause, risk or impact, supporting context, and recommended next steps. The human confirms the work instead of reconstructing it from scratch.
Once an analyst is working an alarm, Plixer AI keeps going. Ask what changed before an interface saturated, which peers a host contacted, or what runbook applies. The AI resolves network objects, runs the right reports, and returns the answer with the evidence behind it.
Plixer AI uses the customer’s own network objects, documentation, policies, and runbooks. When an analyst asks about “the Boston office” or “the primary egress firewall,” the answer maps to real Scrutinizer data, not a plausible-sounding hallucination.
Built for NetOps and SecOps work
For NetOps
When users report app slowness, Plixer AI moves the network team past “is it the network?” and straight to the evidence that answers it. It traces the slowdown to the interface adding latency, the top talker driving congestion, the application path degrading user experience, or the affected segment where it started.
Network teams can verify a fix worked by comparing traffic before and after, confirm which applications are tied to a performance issue, and trace degraded user experience back to a specific interface or segment without manually pivoting between reports.
For SecOps
When prevention fails, Plixer AI shows the security team what happened inside the network. It traces suspicious traffic, abnormal authentication patterns, lateral movement, beaconing, data staging, and possible exfiltration back to the hosts, peers, and timelines involved.
Every finding ties to flow evidence. Security teams can build a defensible timeline, capture packets on demand for forensic review, and tune out the noise keeping the queue focused on real threats. The investigation starts from evidence, not from a notification and a blank screen.
What Changes for Analysts?
The analyst picks up an alarm that’s already triaged: summary, supporting flows, affected hosts, and recommended next step waiting. They check the work, acknowledge or escalate, and move on.
Mid-investigation, the analyst asks in plain English and Plixer AI returns the evidence. Tier-1 analysts stop pinging tier-2 to confirm whether an alarm matters and start closing work themselves.
Overnight triage runs without a human in the loop. Junior analysts handle investigations that previously required senior oversight. Teams work more alarms in less time without adding headcount.
FAQs
AI powered anomaly reports help teams surface, interpret, and refine reports related to unusual patterns in network data using AI-assisted guidance. Rather than performing anomaly detection themselves, these reports make it easier to understand existing anomaly-related insights and determine next steps for investigation.
AI tools support detecting anomalies by reducing the manual effort required to find and interpret relevant reports. By translating natural-language questions into targeted views and explanations, AI systems help analysts focus on meaningful data patterns instead of navigating complex interfaces.
No. AI powered anomaly reports work alongside existing anomaly detection tools and analytics engines. They enhance usability and investigation efficiency by guiding users to the right context, reports, and historical data without changing how anomalies are detected.
By clarifying why certain reports are relevant and how they relate to potential cyber threats, AI powered anomaly reports improve investigation speed and accuracy. This helps teams assess whether unusual behavior could indicate a security issue and take informed action to protect their overall security posture.
Built for environments where AI usually gets blocked
Plixer AI supports two deployment paths. Plixer-managed inference runs through AWS Bedrock in Plixer’s controlled environment: no additional infrastructure, and customer prompts and outputs are not used to train or improve shared foundation models. Customer-controlled deployment points Plixer AI at any OpenAI-compatible LLM endpoint your team chooses, self-hosted, third-party, or sovereign-cloud, with LLM inference staying within the boundary your team controls. Across both options, Plixer AI uses only the minimum data required, favors flow metadata over payload, and scopes retrieval to the user’s investigation context. Role-based permissions and tenant isolation govern access throughout.
Plixer AI works the alarm. MCP lets that work happen from the assistant your team already uses. Same Scrutinizer data underneath.
See it in Action