
A trend of this decade is that we’re being flooded with information and data points. Certainly, an overabundance of data is better than an incomplete picture. But more and more, it’s clear that the ability to analyze data well and draw accurate conclusions is just as important as having access to raw data.
In a field like NetOps, there’s also time pressure, as any delay in resolving issues can lead to poor user experience, downtime, or security breaches. What’s happening in the network to make it slow? Is it a network issue or a security issue? How do you assess the accuracy of your investigation? And how do you determine the best way to solve the issue?
This is where network observability comes in.
What is Network Observability?
The simplest way I’ve found to understand the concept is to first look at the definition of observability, coined by the engineer Rudolf E. Kálmán back in 1960.
As defined by IBM, “observability is the ability to understand the internal state or condition of a complex system based solely on knowledge of its external outputs”.
Therefore, network observability simply means how well you can understand the state of the network by looking at various metrics.
Network Observability vs. Network Monitoring
At first glance, there’s a thin line between these terms. Is network observability just a new marketing buzzword?
Actually, the term is over ten years old, emerging from the IT & engineering community. The earliest instance I’ve seen is a 2013 article by X’s (then Twitter’s) engineering team about their observability stack.
So, then what is the difference between network observability and network monitoring?
Network monitoring refers to the collection of metrics from your network infrastructure. Often, devices can natively provide data—e.g. logs and alerts from firewalls, or various types of flow data from network appliances. In other cases, organizations may install sensors to collect metrics from blind spots. NetOps can then look at this data to determine the health of the network and to troubleshoot issues.
Network observability, on the other hand, goes a step further. It’s a measure of how well this data can be analyzed, contextualized, and actioned upon.
In short, the difference between the two terms is the difference between asking what and asking why.
Why is Network Observability Important?
A small organization may have few issues by relying only on network monitoring. But for larger, more complex networks—e.g., networks spanning multiple locations, multi-cloud networks, or networks with distributed architecture—there is exponentially more data and it’s exponentially harder to analyze.
In this situation, the processes of uncovering, investigating, and resolving issues slow down immensely. This is often due to a lack of context as well; a system may alert you to an issue but fail to provide useful details on how it determined there was a problem. Or you may have data from many different sources on the network, but little insight on how these sources interact with each other.
One common result of poor network observability is a high number of unactionable alerts. In fact, many NetOps teams, as well as SecOps and DevOps, report alert fatigue.
Good network observability enables you to identify, investigate, and resolve issues efficiently, even in a complex environment. This is especially helpful with common concerns like:
- Optimizing network performance
- Minimizing network downtime
- Detecting and resolving security threats
Use Case: Network Monitoring vs. Network Observability
Below are two network monitoring reports that show latency metrics for various Layer 7 applications.
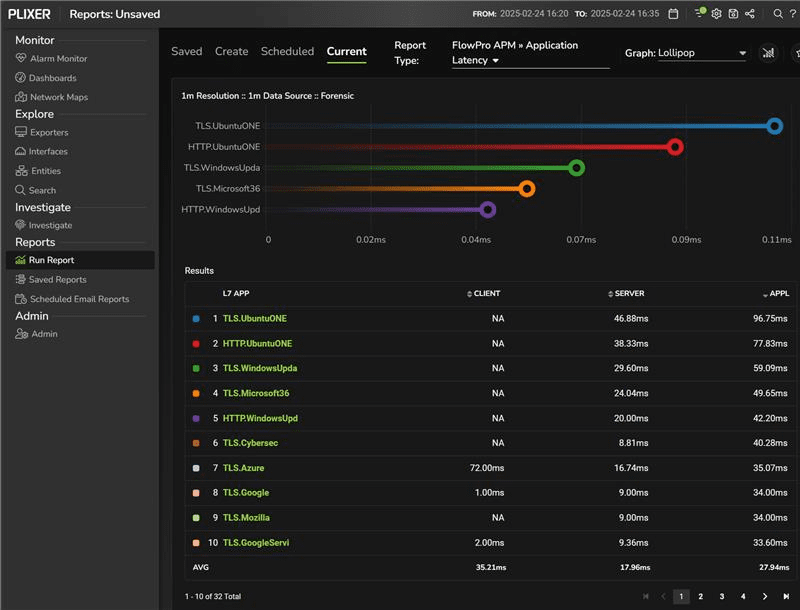
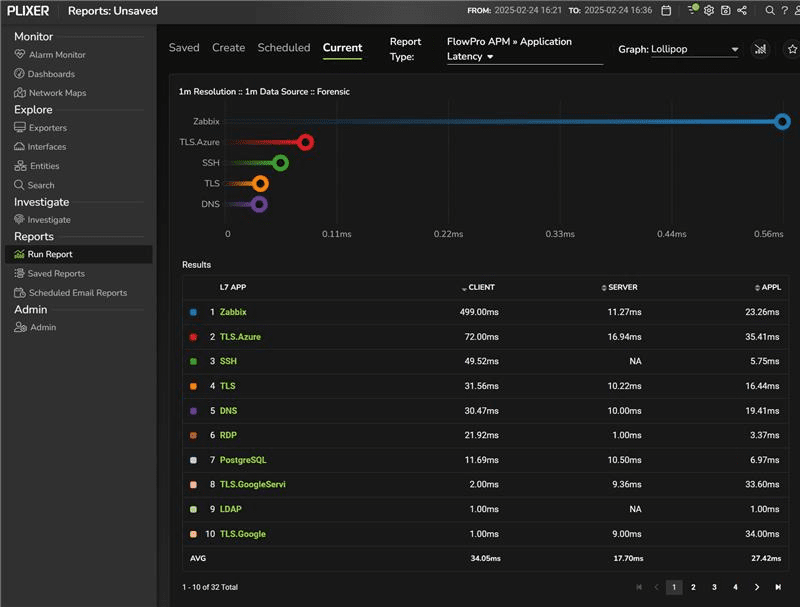
In these cases, the reports provide:
- Latency values for client, server, and application
- Per-protocol performance breakdown, helping identify problematic services
- Basic real-time monitoring, which is useful for reactive troubleshooting
These are useful metrics that help tell what is happening in the network, but they require manual interpretation to derive meaning and detect patterns.
By contrast, the next image includes forecasting.
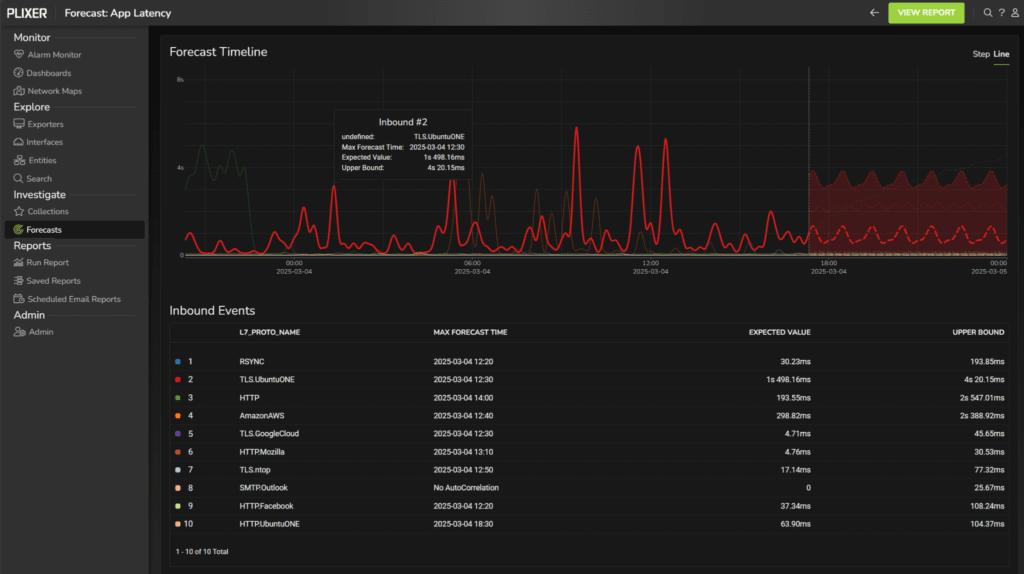
Instead of simply presenting raw latency data, it:
- Predicts future performance, setting expected values and upper bounds
- Identifies potential outliers, reducing troubleshooting time
- Enhances raw visibility data with analytics, enabling proactive resolution
In this case, data enrichment and predictive analytics foster a proactive approach, rather than a reactive one.
How to Improve Network Observability
Our NetOps experts recommend that organizations implement five key components to improve network observability:
- Comprehensive telemetry data: This includes metrics, logs, events, and traces from various components on the network, collected across all layers. This ensures the strongest telemetry and a full view of the entire network.
- End-to-end traffic flow visibility: Visibility into every hop and connection allows NetOps to track data from origin to destination, providing better context. This helps identify issues like bottlenecks, latency, and potential vulnerabilities.
- Real-time analytics and contextual insights: Real-time analytics enables NetOps teams to better keep track of what’s happening on the network at any moment. Context comes from correlating telemetry data to gain a better understanding of root cause.
- Automated anomaly detection and alerts: NetOps teams can leverage machine learning and automation to improve the quality of alerts. Rather than basic alerts that rely upon simple thresholds, ML allows for the automatic detection of unusual patterns and behaviors. This means that alerts come with more intelligent insights into probable cause, mitigating alert fatigue and allowing for more efficient response.
- Intelligent dashboards: Having to reference a dozen different dashboards degrades the actionability of data. Intelligent dashboards and reports allow NetOps to make informed decisions quickly by consolidating relevant data into a single view.
A Common Challenge
Tool integration complexity can inhibit network observability. NetOps teams frequently have to switch between many different tools—for example, they may use their firewall’s proprietary reporting tool separately from their network switches’ reporting tool and then reference SIEM logs on top of all that. Part of the issue is that different vendors use different types of data, and many reporting tools lack the ability to ingest all of them.
Naturally, this is a detriment to NetOps’ ability to action upon issues and hurts MTTR. Therefore, it’s important to implement a reporting system that can ingest all kinds of telemetry data, as well as handle high volumes of data.
Concluding Thoughts
If your NetOps team manages a complex network, it’s likely difficult to fully understand the state of the network and effectively resolve issues. Network monitoring provides some indication of network health but often lacks actionable insight.
Network observability enables NetOps to more effectively resolve issues as they arise. This is due to a combination of comprehensive visibility, automated detection with contextual insights, and intelligent reporting.
If you’d like to see more use cases, check out our webinar on leveraging user behavior analytics for deeper network observability.
Related

Three Ways Universities Use Plixer One to Solve Common Network Problems
With thousands of users and connected devices, ensuring network reliability, security, and compliance is a significant challenge for universities. Network observability—the ability to gain