When this pandemic started and nearly the entire workforce went remote, our focus was to maintain the quality of service outside of what was then normal operations. Although it seems like we still have a long road to travel, we are starting to see signs of progress. Globally, many companies are opening up their offices and giving their employees the choice of working in the office or from home. For network administrators, this adds another layer of headache.
Today’s admins are challenged with not only monitoring the remote connections, but at the same time making sure the employees who’ve ventured back into the physical world get that same level of service.
That brings us to today’s blog. Although I’ve simplified things quite a bit, the challenge that inspired this post came from a real-life example. The idea is that a system admin needed to make a management-level view that showed the traffic for the past 30 days and the traffic that was happening now. With that, the manager could get a quick idea of how balanced the resources for the VPN users and in-office users were.
The first step was to create a report that showed that last 30 days of traffic. To do this, you simply click on the Explorer tab (1) and then filter down to the device in question (2).
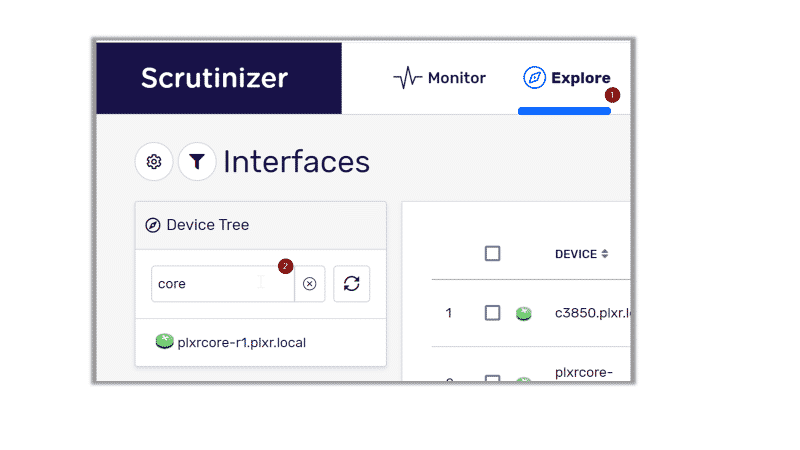
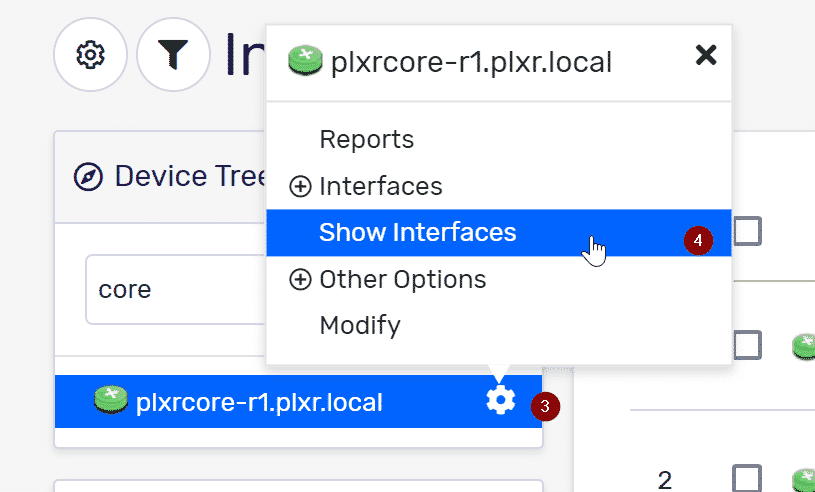
Now we need to show the interfaces for this device. You can mix and match devices and interfaces in any report, but for this example we’ll just use one device and all of its interfaces. To do this, click on the small gear icon (3) and then select Show Interfaces (4).
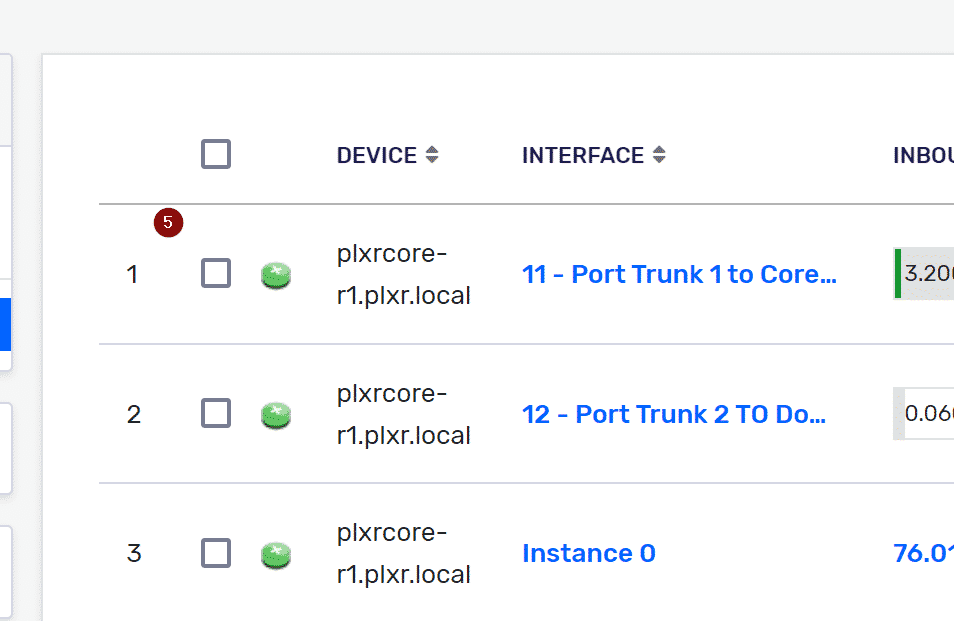
At this point you will see all the interfaces for that device on the right-hand side of the screen. Use the checkboxes (5) to select which interfaces you want to report on. I check the one at the very top to select all of the interfaces for this device. Once you have selected all the interfaces that you want to see data from, click on the Run Reports button and the reporting engine will do its magic!
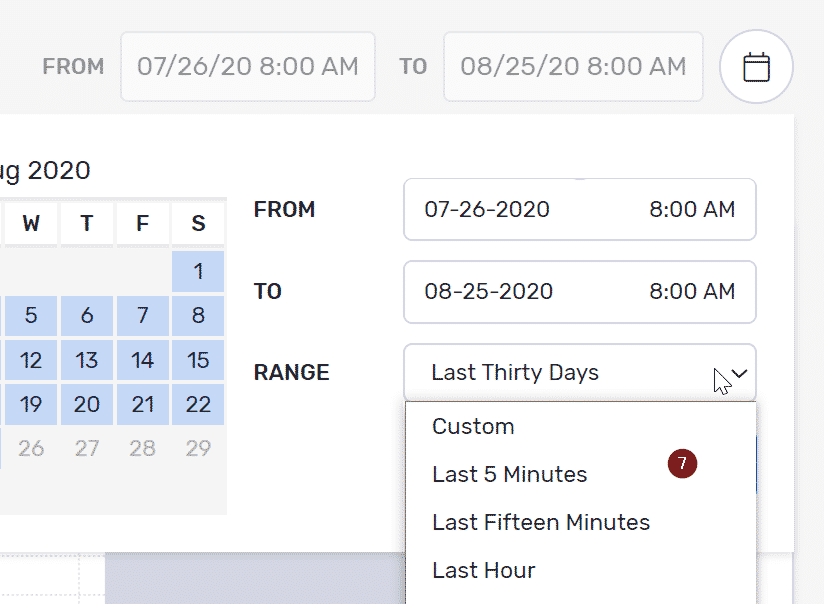
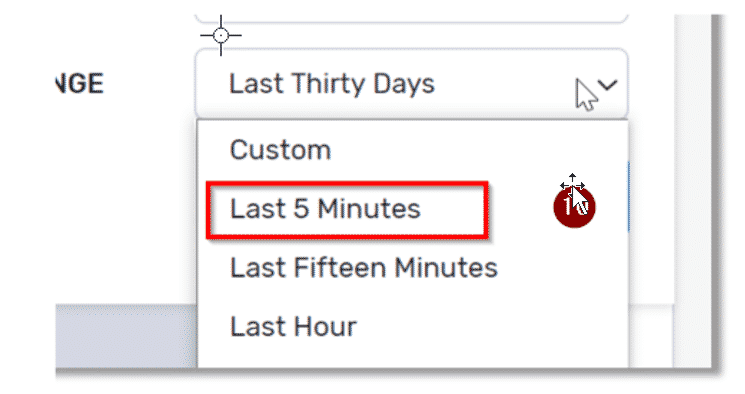
Once the report generation is complete, we will need to change the timeframe for this report. To do this, we’ll what is called a “Rolling Timeframe.” In the upper right-hand side of the report, there are two date boxes. Click on the little calendar icon and you will see the rolling timeframe options (7). In the first report we want to see all the data from the last 30 days.
Now we should have the report we were looking for. In this example, I used the Sankey report type, but a pie chart would also do.
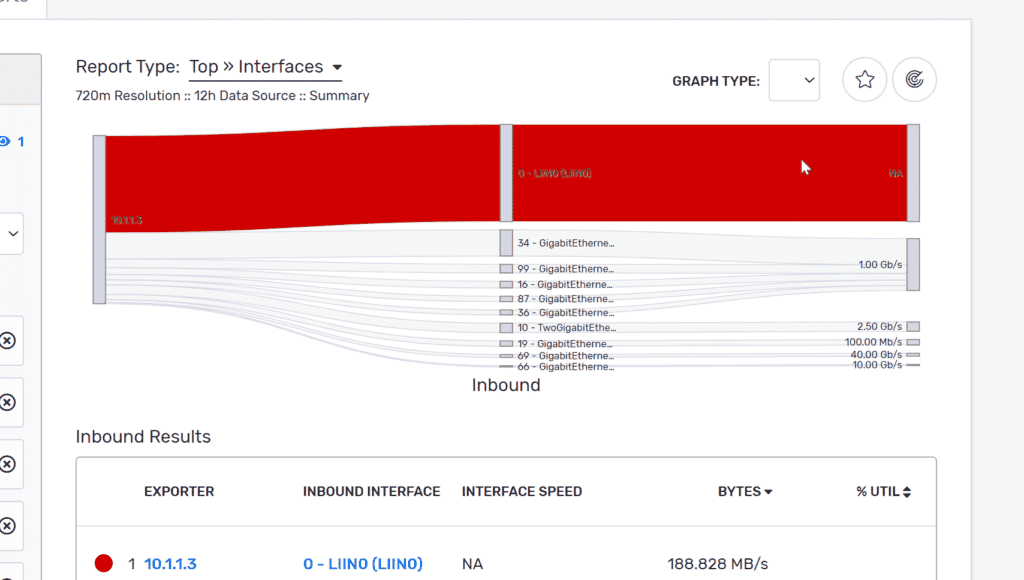
The next step is to build a management-level view, which means saving it to a dashboard where the powers that be can quickly see a historical view and a live view of the data pipes that both the remote and onsite employees are using.
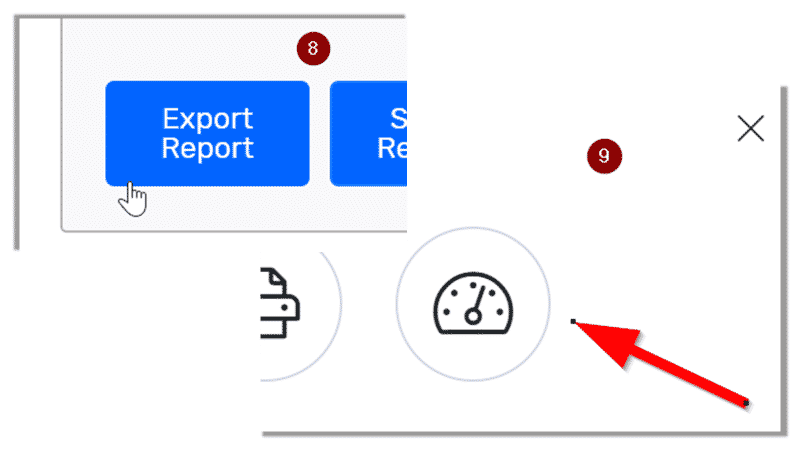
Near the bottom left-hand side of the page, there is an Export Report button (8). When you click on that, you will be presented with a modal that allows for various exports. Click on the small gauge icon to export this report to the appropriate dashboard.
Remember, the admin needed to create two reports for this management view. The good news is that all you have to do is repeat these steps but change the rolling time frame to the last five minutes.
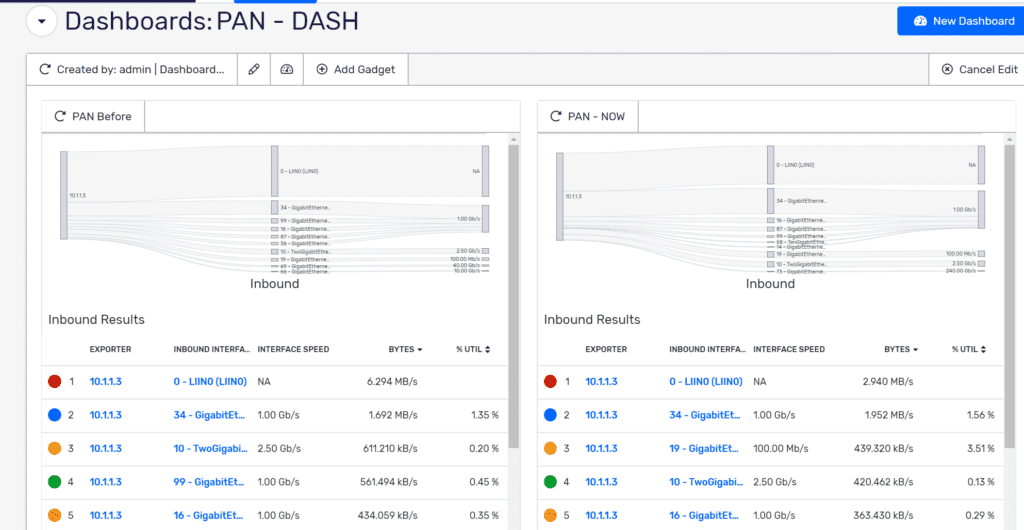
There you have it. In just a few clicks, we were able to create a rolling 30-day report that showed all of the traffic for the interfaces that handled the employee traffic, as well as one that showed the current use of those same interfaces.
As I mentioned before, I simplified this for this post. In the real-world examples, the end user employed more filters, like IP Groups and NBAR-based applications. They were also trying out forecasting via Plixer’s latest machine learning release, Plixer Network Intelligence. In today’s ever-changing world, we face an increased number of remote employees. As I mentioned before, the lines between remote and in-house workers are getting blurred. Making sure that those employees have access to their day-to-day applications has become a top priority. Are your NetOps and SecOps teams working together to make sure this happens? Are you looking for conversation-rich visibility along with the flexibility to integrate that data into your current environment and share across departments? Why not evaluate Scrutinizer?


