Ever look at the NetFlow details of a conversation and wish you had the full packets to look at? Combining your NetFlow solution with an open source packet capture tool can greatly enhance insight into your network. Today I want to discuss Moloch packet capture integration with a NetFlow solution as well as how you can take that conversation and get full packet details with a simple click. In a previous blog, I mentioned the use of packet capture tools with NetFlow for troubleshooting and we looked at some filters you can manually add to narrow your results. This is no longer needed, as a you can pass filters like source IP, to see the full Moloch packet capture details for further analysis right from your NetFlow report.
What is Moloch?
Moloch is described on Elastic’s website as a “simple web GUI for browsing, searching, viewing and exporting PCAP data.” [source] and as I learned while researching and watching their Moloch webinars, some refer to it as the “AOL Search for PCAPs”.
Essentially Moloch is a an open source tool that is comprised of three main components:
- Capture
- Database
- Viewer
Nodes deployed on your network do the capturing of data and create what Moloch calls “SPI” data (Session Profile Information) that is indexed and stored for future queries. When you make a call to Moloch for data, the Database component comes into play, and in the back end, is powered by Elasticsearch, Moloch can quickly parse through the SPI data for relevant data. You can view the results of the query as well as add others through the web interface, the Viewer. For those that want to play around with the tool, there is a Moloch demo server available at molo[dot]ch where you can drill into some sample data.
Moloch Packet Capture Integration
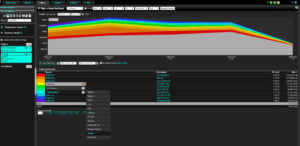
 So what does Moloch NetFlow integration look like? In the image to the right, my NetFlow report is filtered on an IP address and a time frame; the IP is the source in a conversation taking place with an outside IP address. To see the Elasticsearch Moloch information captured on my nodes, I just need to click the Moloch option from the flow report to pass the time frame and the IP address to Moloch.
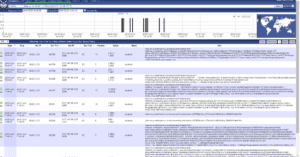
The following image is a screenshot from the Moloch viewer web interface, with filters automatically added, to perform the query.  Elasticsearch returns all the relevant data and Moloch allows you to drill into this data and see the full packet details. Not only do we have alarms and alerts from our NetFlow exports, but now we also can correlate packet captures with the same data. With this correlation you have even more details such as where traffic is coming from and where its going to, what sites are being visited, what applications are traversing the network, etc. In the image you can see the Info column is displaying full URL details of the sites that this host was visiting as well as where in the world the destination is located. Perhaps now we could run a NetFlow report filtered on specific traffic and pass the filter to Moloch to see the packets within those flows?
If you are looking for assistance or more information on how to integrate your Moloch server with Scrutinizer, don’t hesitate to call us at Plixer to help you with the integration.

