The next version of our incident response system, Scrutinizer, will include a groundbreaking integration with Endace packet capture. Using Scrutinizer’s award winning interface, you can now download the packets related to an observed issue from the Endace probe. This helps you reduce the overall time to research and remediate issues. For those of you out there that want the both flow data to quickly report on incidents as well as packet captures to dig even deeper, look no further. In this blog, I will cover not only the integration, but how to report on your Endace probe from within Scrutinizer.
Setting up Endace Packet Capture integration
In order to configure Scrutinizer to report on the packets from your Endace probes, you must first enable (add) the probe via the scrut_util.exe function on your Scrutinizer appliance. Here are the commands to run to configure your probes.
Add a probe:
-endaceprobe add --host <ip> --port <port> --user <user> --pwd <pass>

Remove a probe:
-endaceprobe remove --host <ip>

Change/Update a probe
-endaceprobe update --host <ip> --port <port> --user <user> --pwd <pass>
Accessing Endace Probes in Scrutinizer
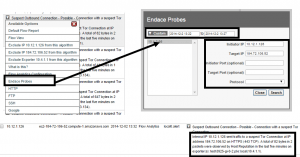
There are three ways to access the probes from within Scrutinizer. The Tree Menu, Violated Alarms, and Reports with IP Address.
The Tree Menu
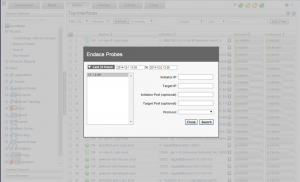
To access Endace Reports via The Tree Menu, select the status tab. Under Device Explorer select Wizards, and click on Endace Probe. This option allows you to access the Endace device without already being in a report. This is especially handy when you already know the ip addresses, protocol, and ports.
Violated Alarms
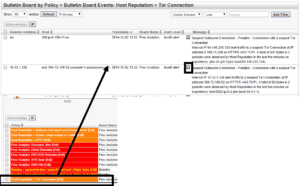
To access Endace Reports via Violated Alarms, select the alarms tab. Select the alarm you want to open the violators in the Bulletin Board view. Then click the dropdown between Alarm Level and Message. Select Endace Probes to filter from the probe. Any relevant details from the alarm are pre-populated. This is useful because you can get to the actual packets from conversations that triggered alarms.
Reports with IP Address
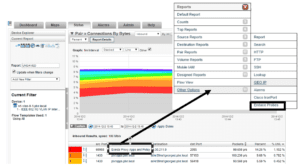
The Reports with IP option allows you to select from a report the source or destination IP (or DNS) and get information from your Endace probes. To do this select the source or IP address (or DNS name) and select Other Options at the bottom of the list, then choose Endace Probes.
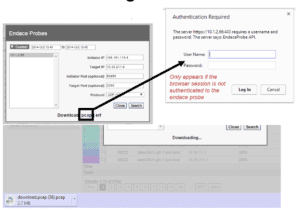
A modal will open pre-populated with relevant details from the report. Select search, then download the raw packets and open then in your favorite analyzer. When you simply want to investigate a little further into a conversation you can see in a generated report, this is a great option.
A few caveats about this integration
- Only our hardware and virtual appliance support this integration
- The advanced reporting module is require to report on the Endace probes.
Look for Scrutinizer 12.1, planned for release in Q1 2015, and let us know if we can help you setup this integration.
