I was recently on a call with a customer who wanted to know which applications use the most bandwidth during working hours—i.e. their top talkers. This gave me a great opportunity to review a specific feature of Flexible NetFlow and AVC integration. I’ve decided to build a small lab with a simple network configuration where I could set up a couple of VLANs, a trunk communication between L2 and L3 devices, and couple of devices. The end goal is to define what host under what VLAN is using what application the most.
Here is my network diagram:
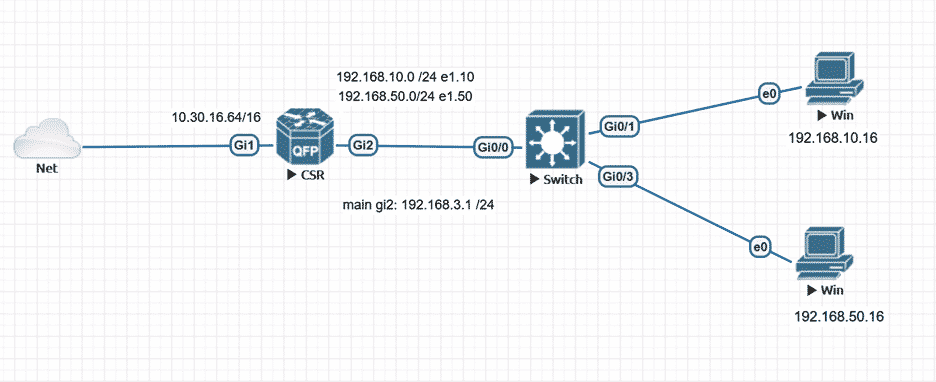
As a main device I picked a CSR1000v, but it can be any other device that supports NetFlow or IPFIX (Flexible NetFlow) and AVC. Layer-2-related features are added into the NetFlow configuration of the device, where my goal is to define Layer-2 communications. This will help us define the end host.
Here is the configuration of the flow record, where highlighted features are related to Layer 2:
flow record Plixer-in
   match ipv4 tos
   match ipv4 protocol
   match ipv4 source address
   match ipv4 destination address
   match transport source-port
   match transport destination-port
   match interface input
   match flow direction
   match application name
   match routing source as
   match routing destination as
   collect routing next-hop address ipv4
   collect ipv4 dscp
   collect ipv4 id
   collect ipv4 source prefix
   collect ipv4 source mask
   collect ipv4 destination mask
   collect transport tcp flags
   collect interface output
   collect counter bytes
   collect counter packets
   collect timestamp sys-uptime first
   collect timestamp sys-uptime last
   collect ipv4 destination prefix
   collect datalink destination-vlan-id
   collect datalink source-vlan-id
   match datalink destination-vlan-id
   match datalink mac destination address input
   match datalink mac destination address output
The rest of the IPFIX configuration is pretty straightforward. Here is the configuration, including a flow exporter and flow monitor configuration and applying it under the required interface.
flow exporter PLIXER
   destination 10.30.16.80
   source GigabitEthernet1
   transport udp 2055
   export-protocol ipfix
flow monitor FM-PLIXER-IN
   exporter PLIXER
   cache timeout inactive 10
   cache timeout active 60
   record Plixer-in
The next step is to apply AVC configuration, which can be found in here.
Once all configuration steps are done, let’s go ahead and take a look at what we can get. In this example, I’ll be using our proprietary tool, Plixer Scrutinizer, which is a great tool from DPI perspective and gives us a graphical view of what is happing within the network. Let’s take a look at what Scrutinizer shows from our demo router named test1K:
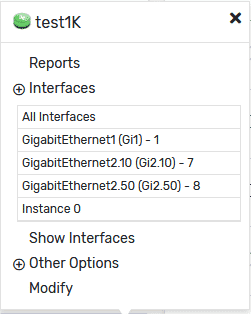
In this picture, we can see that interface Gi1 is the primary one; this is where all configurations been applied. But besides the primary interface, we also see the sub-interfaces where our VLAN 10 and VLAN 50 live. Since we’ve included Layer-2 data collection, why wouldn’t we use it? Let’s run a pair report and see if we can define conversations between VLANs 10 or 50 and VLAN 0, which is our default VLAN.
Here is the output:


Based on this output, it looks like VLAN 10 is one of our top talkers, but how we define which host within the VLAN talks the most?
Once we can define the MAC address, we can define the IP address of the device as well.
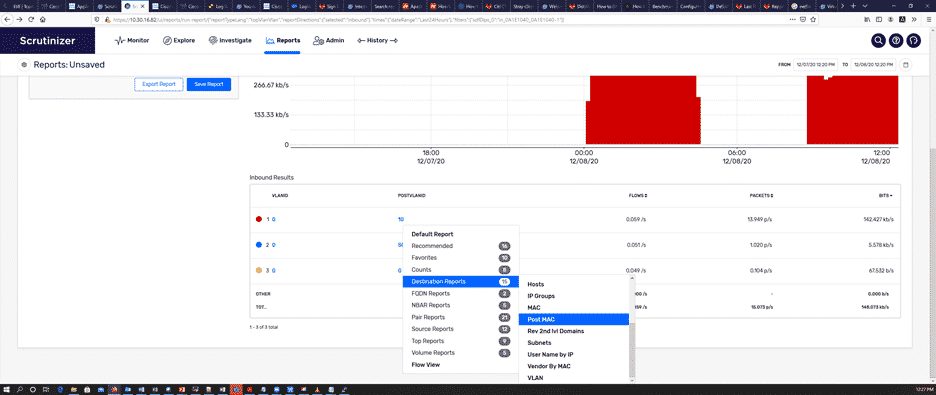
And here is our host. Now it’s time to compare a DHCP binding table within a router against this MAC address:


Is our end goal accomplished? Probably, after we define what type of application the customer was using. Here is the answer:
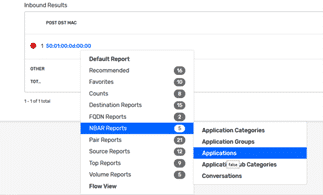
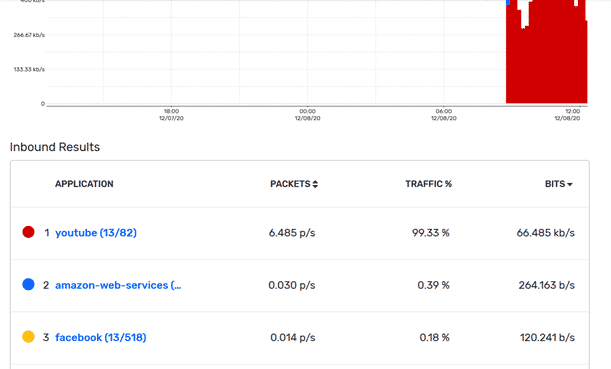
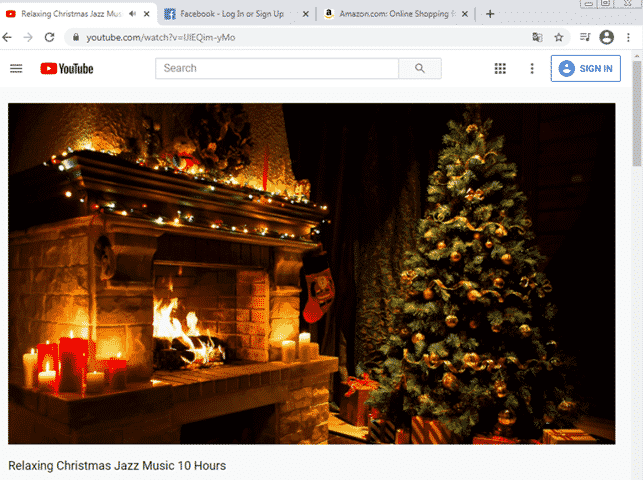
The main purpose of this blog was to highlight the effectiveness of using NetFlow and AVC together with Scrutinizer for finding top talkers on your network.


